
Cross-Framework Performance Benchmarks
TL;DR. One harness drives nine participants — Lauren, FastAPI, Starlette, Litestar, BlackSheep, Sanic, Falcon, Quart and a hand-written ASGI floor — through five workloads, five repeats each, in-process through
httpx.ASGITransport. Lauren lands mid-pack and stays there: 3rd to 6th of the eight frameworks measured on every workload, with a five-repeat range that overlaps Litestar's and Sanic's on all five workloads, FastAPI's on four and BlackSheep's and Falcon's on four, and is cleanly separated only from Quart. Starlette, Falcon and BlackSheep take the podium (in the top three on four or five workloads each); Quart is last on four of five. The hand-written floor — no framework in the request path at all — runs only 1.13x to 1.24x faster than the best measured framework, a margin narrower than the spread of the cells it compares: read that as "the whole framework layer costs a few tens of percent on this machine", not as a fixed factor the floor wins by. Cold start is where Lauren pays for its startup validation: 707 ms to a served request (median of five, spread 28%), against 552 ms for the floor, with 318 ms of that being imports and 98 ms constructing and validating the application. Two frameworks — aiohttp and robyn — could not be driven in-process at all and have no number here.
What this page reports
| Section | What is in it |
|---|---|
| The machine and the dependency set | CPU, interpreter, OS and the exact framework versions behind every number |
| The five workloads | The request each participant had to answer |
| Throughput | Median requests/second per workload, with the spread across repeats |
| Latency | p50 / p95 / p99 of the in-process round trip |
| Startup | Time to serve for a cold process, broken into import, app construction and the first request |
| Serialization stacks | Which JSON encoder and validation path each framework actually ran |
| Not measured | The two frameworks the in-process approach could not cover, and why |
Deliberately absent: memory and RSS. They are out of scope for this comparison, so no memory figure appears anywhere on this page. This page reports throughput, latency and startup time, and nothing else.
How the numbers are produced
The harness lives in benches/. benches/bench.py is the entry point, benches/worker.py does one measurement, benches/workloads.py defines the requests and their expected answers, and benches/baseline_app.py is the framework-free floor.
One process per measurement
Every (framework, workload, repeat) runs in a freshly spawned interpreter with its own application and its own event loop. Nothing is shared between repeats or between frameworks.
That is not decoration. Several frameworks in this field patch shared classes at import time, and Sanic cannot stand up a second application in one interpreter at all — its touchup scheme compiles patched handler methods into a table keyed per app, and a second app in the same process leaves applications unable to start. An earlier revision of the harness built one fresh app per repeat inside a single process and watched Sanic fail on the second repeat. Rather than special-case one framework, every framework gets the same isolation.
The cost is real and is stated rather than hidden: one interpreter boot per repeat, which is why a full run takes about six minutes.
Rounds, not blocks
Repeats are interleaved round-robin: round r measures every framework and every workload before round r+1 starts. If the machine drifts — thermal throttling, a neighbour waking up — the drift lands on all participants instead of only on whoever was measured last.
The contract is re-checked in every timed process
The damaging outcome of a benchmark is not a wrong number, it is a fast wrong number. So each timed process re-checks its workload's status code and body against benches/workloads.py on the very application instance it is about to time, and the run aborts on a mismatch. Nothing here is timed that has not just answered correctly.
What each number means
| Number | Definition |
|---|---|
| Throughput (req/s) | Completed requests ÷ elapsed wall time of one repeat |
| Latency p50/p95/p99 (ms) | Per-request round trip as the in-process client observes it, pooled over a repeat, by linear interpolation |
| Spread (%) | (max − min) / median × 100 over the per-repeat values of that statistic |
Startup: process_ms | The parent's wall clock around a whole startup subprocess — interpreter boot through process exit, so it is an upper bound on time to serve and carries each framework's teardown at the end |
Startup: harness_import | Inside the child: process start → harness and framework imported |
Startup: build_app | Application object constructed, routes registered |
Startup: first_request | The lifespan startup handshake plus the first real request, checked against the same hello contract the timed workloads use |
Repeats use --warmup 0.25 (discarded) and --duration 0.5 (timed), one in-flight request at a time, and every statistic is the median of five repeats with its spread.
Warning: These are in-process numbers
httpx.ASGITransportcalls the application directly: no socket, no server process, no TLS, no kernel scheduling. That is what makes the comparison repeatable and fair — every participant pays the same client cost, and no one gets a different server configuration — but it is not a deployed-configuration number. A uvicorn/gunicorn/granian deployment over a socket will move these numbers, and the ratio between frameworks can move with it. Read this page as "how much does the framework layer itself cost?", not as "what will my service do in production?".The latency figures include the httpx client and the ASGI transport, not handler-only time, for the same reason: the client is common to everybody.
Reproducing this page
The pinned dependency set lives in benches/requirements-bench.txt, and one command prepares the environment and runs the harness:
nox -s bench_frameworksIt creates benches/.venv with Python 3.13, installs the pins (re-running the install every time, so the pins are enforced even if the venv has drifted), runs the harness, and prints the path of the artifact it wrote. Arguments after -- go straight to benches/bench.py:
nox -s bench_frameworks -- lauren fastapi          # measure a subset
nox -s bench_frameworks -- --repeat 1 --duration 0.1 --startup-repeats 0
The numbers on this page come from benches/results/frameworks-inprocess.json, committed next to the harness, which records the environment, the installed versions and a SHA-256 of every harness file it ran. If you only want to know whether every framework answers correctly, python benches/run.py re-runs the contract checks in seconds.
The machine and the dependency set
| CPU | Intel Core Processor (Broadwell, no TSX, IBRS), 8 logical cores |
| Interpreter | CPython 3.13.13 |
| OS | Linux-7.0.0-14-generic-x86_64-with-glibc2.43 (x86_64) |
| Measured (UTC) | 2026-10-12T05:55:41+00:00 |
| Harness revision | 2da3201 on feat/benchmark, working tree clean |
| Artifact schema | lauren-framework-bench/1 |
| Participant | Distribution | Version |
|---|---|---|
| lauren | lauren | 1.8.0.post17 |
| fastapi | fastapi | 0.143.0 |
| starlette | starlette | 1.7.0 |
| litestar | litestar | 2.24.0 |
| blacksheep | blacksheep | 2.6.4 |
| sanic | sanic | 25.12.1 |
| falcon | falcon | 4.4.0 |
| quart | quart | 0.23.1 |
| baseline | — | n/a — reference floor, not a framework |
The pins matter to the numbers. Several frameworks switch JSON encoder on whichever fast library happens to be importable, so the same "framework version" can produce a different table on a different machine. The serialization table below records what each participant actually ran.
The five workloads
| Workload | Request | What it exercises |
|---|---|---|
hello | GET / | Route lookup and response construction, nothing else — the floor. |
json | GET /json | Serializing a nested, multi-typed payload. |
path_query | GET /items/42?limit=10&q=abc | Extracting and type-coercing one path and two query parameters. |
di | GET /di | Resolving a collaborator through each framework's own injection mechanism. |
validation | POST /validate with {"name":"ada","age":36} | Validating and coercing a request body, then serializing a derived model. |
Throughput (requests per second)
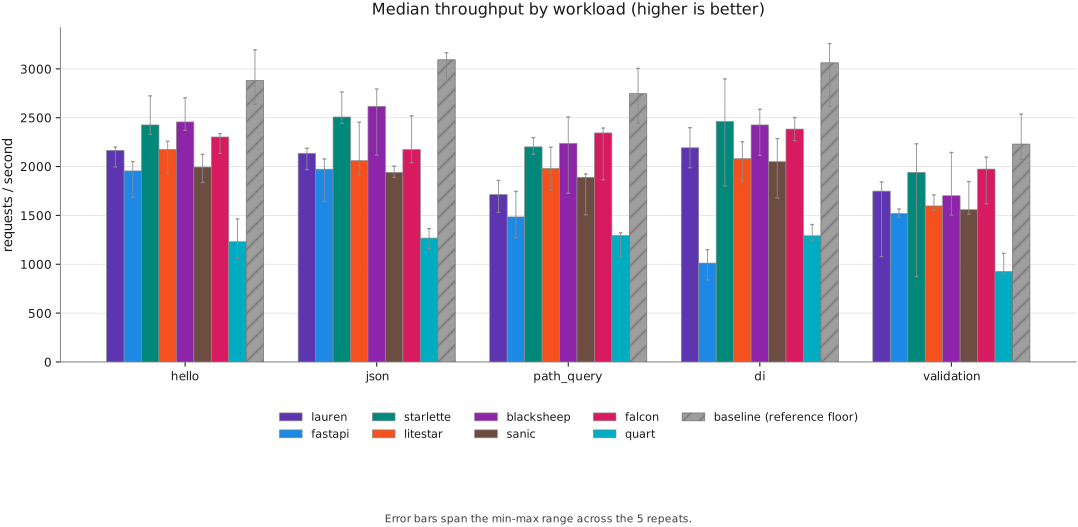
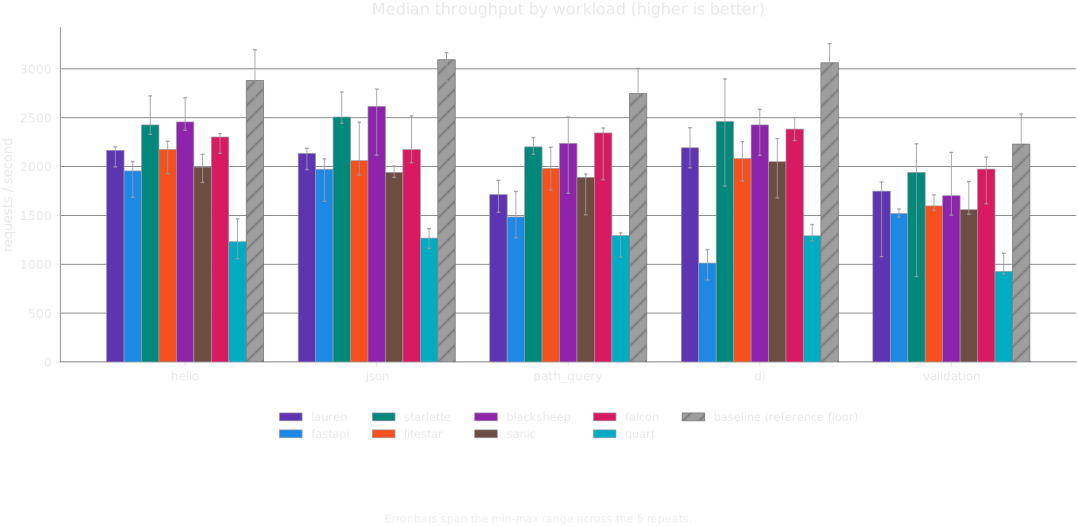
Median of five repeats, higher is better. baseline is the hand-written ASGI callable with no framework in the path — the floor the harness itself can reach, included so you can tell framework cost from client cost. It is not a competitor, and its margin should not be read as one: the 1.13x–1.24x it holds over the best framework in this table is narrower than the spread on most of those cells, and re-running nox -s bench_frameworks has moved that margin by more than its own size — once putting the floor behind the best framework outright. Treat the floor as the reference point for what the client costs, not as a leaderboard entry.
| hello | json | path_query | di | validation | |
|---|---|---|---|---|---|
| lauren | 2166.39 | 2134.53 | 1713.02 | 2191.76 | 1748.13 |
| fastapi | 1955.18 | 1973.27 | 1484.26 | 1012.29 | 1519.4 |
| starlette | 2426.36 | 2507.41 | 2201.63 | 2461.87 | 1940.94 |
| litestar | 2175.45 | 2060.24 | 1980.91 | 2081.1 | 1596.75 |
| blacksheep | 2457.04 | 2616.47 | 2237.05 | 2426.15 | 1701.08 |
| sanic | 1994.73 | 1940.33 | 1889.62 | 2049.61 | 1558.08 |
| falcon | 2302.55 | 2173.95 | 2343.97 | 2383.48 | 1974.44 |
| quart | 1230.52 | 1267.88 | 1293.87 | 1291.31 | 926.7 |
| baseline | 2881.14 | 3093.45 | 2746.34 | 3061.96 | 2230.12 |
The spread tells you how much of a difference to believe. Median spread across the 45 cells is 19.4%, the tightest is 5.5% (FastAPI's validation) and the widest is 70.0% (Starlette's). Treat any gap smaller than the spread of the cells you are comparing as unresolved: on this machine that means most of the mid-field ordering, which is why this page reports the medians and their dispersion side by side rather than a ranking.
| hello | json | path_query | di | validation | |
|---|---|---|---|---|---|
| lauren | 9.4 | 10.2 | 19.05 | 18.7 | 43.74 |
| fastapi | 18.77 | 22.0 | 31.97 | 30.69 | 5.48 |
| starlette | 16.23 | 12.81 | 7.75 | 44.6 | 70.04 |
| litestar | 15.24 | 26.28 | 22.14 | 19.4 | 9.88 |
| blacksheep | 13.58 | 25.86 | 34.92 | 19.4 | 37.71 |
| sanic | 14.43 | 5.96 | 22.15 | 29.6 | 21.5 |
| falcon | 8.78 | 22.11 | 22.64 | 9.91 | 24.15 |
| quart | 33.0 | 15.95 | 19.18 | 13.0 | 22.92 |
| baseline | 19.37 | 9.51 | 20.36 | 21.01 | 20.61 |
Latency
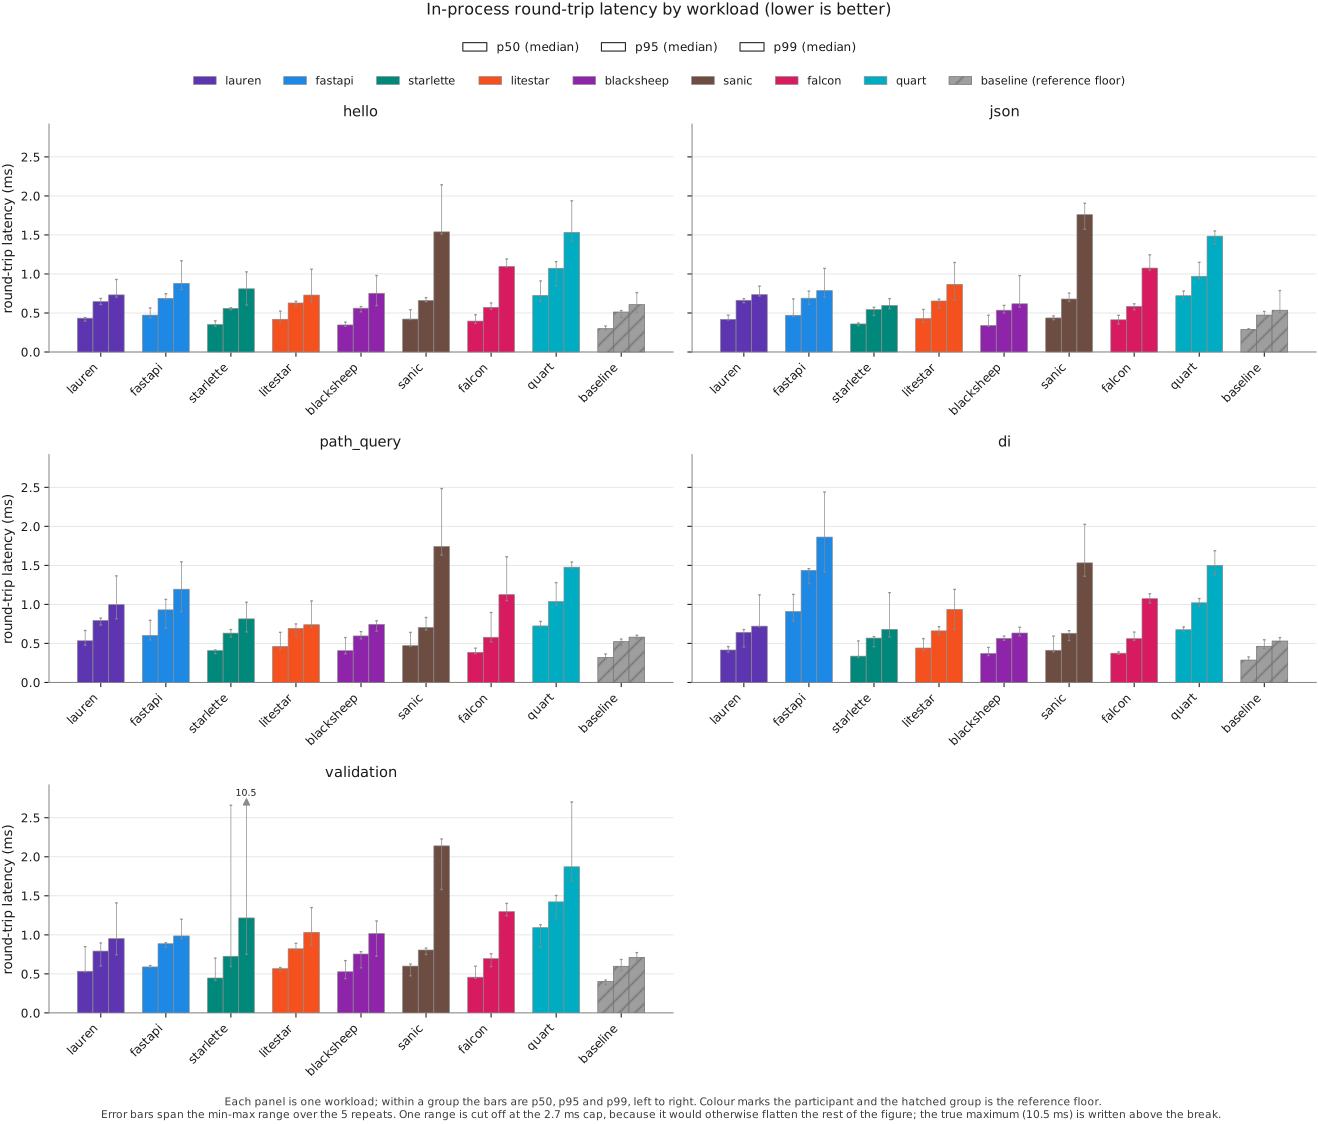
Median of five repeats of the per-request round trip, in milliseconds, lower is better. The same nine participants, the same workloads.
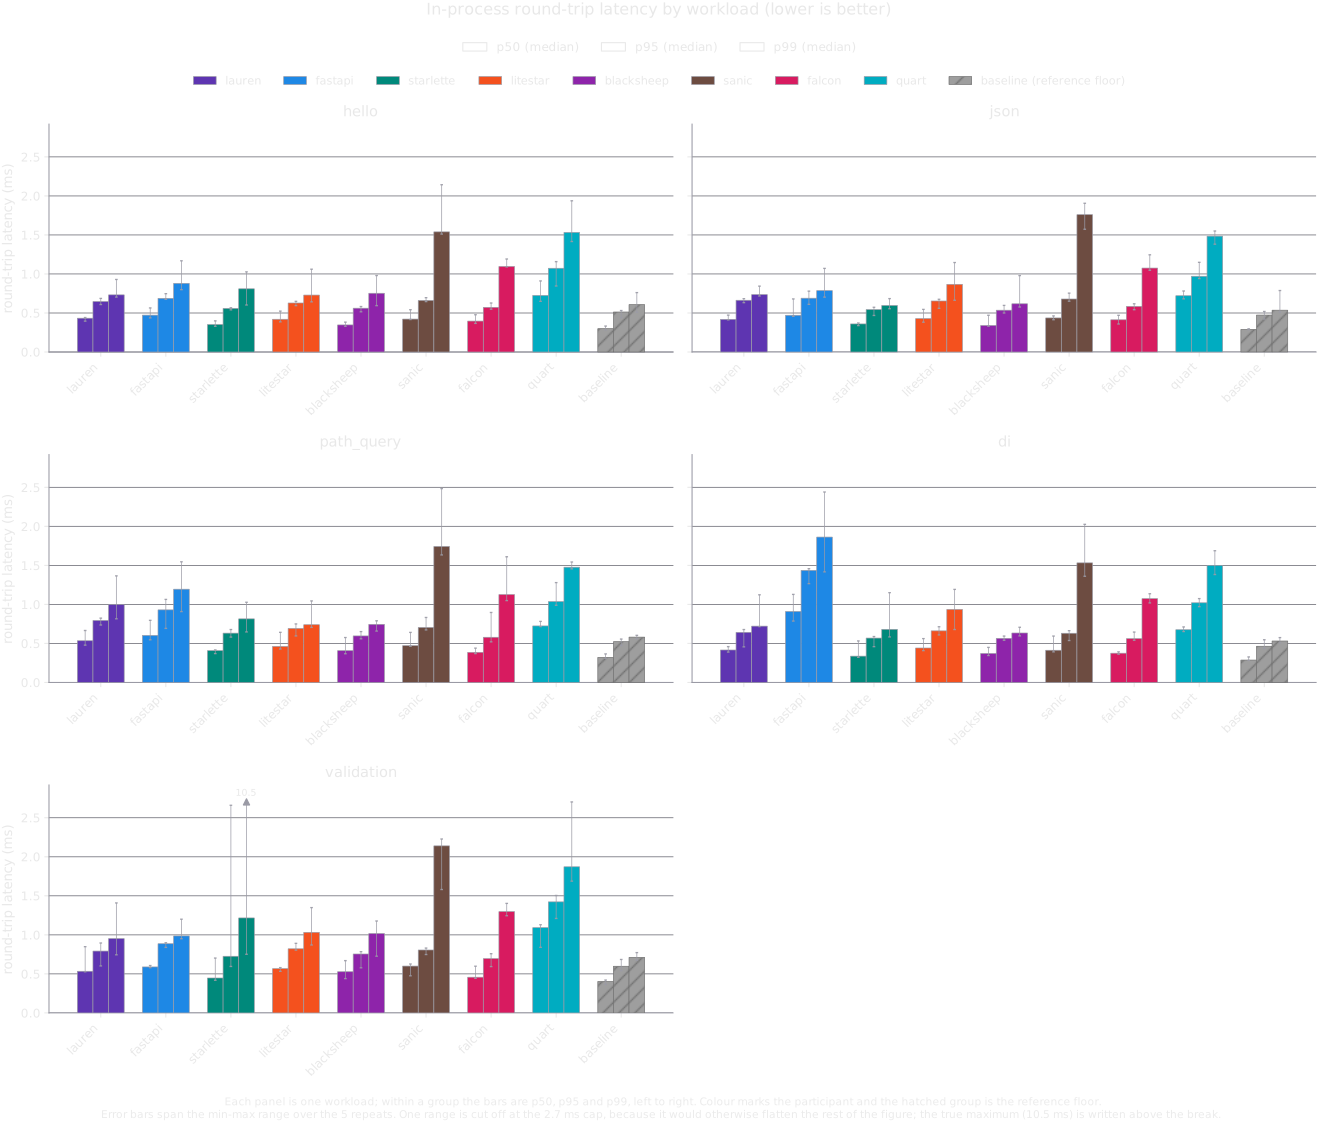
One range does not fit the axis: Starlette's validation p99 reaches 10.50 ms, nearly four times the next-largest range in the artifact, so the latency error bars are capped at 2.7 ms. That range is cut off at the cap and carries its true maximum above a break marker, rather than flattening every other bar into the bottom of the chart.
p50
| hello | json | path_query | di | validation | |
|---|---|---|---|---|---|
| lauren | 0.4336 | 0.4187 | 0.5341 | 0.4155 | 0.5332 |
| fastapi | 0.4725 | 0.4707 | 0.6032 | 0.9093 | 0.5889 |
| starlette | 0.3518 | 0.36 | 0.4072 | 0.3371 | 0.447 |
| litestar | 0.4197 | 0.4279 | 0.4623 | 0.4418 | 0.5666 |
| blacksheep | 0.3467 | 0.34 | 0.4069 | 0.3713 | 0.5276 |
| sanic | 0.4218 | 0.4369 | 0.4716 | 0.4128 | 0.6002 |
| falcon | 0.3969 | 0.4129 | 0.3863 | 0.3749 | 0.4569 |
| quart | 0.7255 | 0.7211 | 0.7241 | 0.6758 | 1.0921 |
| baseline | 0.2989 | 0.2894 | 0.3207 | 0.2871 | 0.4028 |
p95
| hello | json | path_query | di | validation | |
|---|---|---|---|---|---|
| lauren | 0.6467 | 0.6634 | 0.7944 | 0.6418 | 0.792 |
| fastapi | 0.6882 | 0.6895 | 0.9297 | 1.4361 | 0.8857 |
| starlette | 0.559 | 0.5436 | 0.6322 | 0.5689 | 0.7253 |
| litestar | 0.6284 | 0.654 | 0.6916 | 0.6605 | 0.8213 |
| blacksheep | 0.561 | 0.5361 | 0.5962 | 0.5655 | 0.7548 |
| sanic | 0.6603 | 0.6791 | 0.7047 | 0.6305 | 0.8059 |
| falcon | 0.5721 | 0.5844 | 0.5791 | 0.5608 | 0.6951 |
| quart | 1.0731 | 0.9709 | 1.036 | 1.0206 | 1.4227 |
| baseline | 0.5125 | 0.4738 | 0.5222 | 0.4637 | 0.5975 |
p99
| hello | json | path_query | di | validation | |
|---|---|---|---|---|---|
| lauren | 0.732 | 0.7359 | 0.9971 | 0.7217 | 0.9518 |
| fastapi | 0.8799 | 0.7866 | 1.1949 | 1.8623 | 0.9858 |
| starlette | 0.8098 | 0.5968 | 0.8149 | 0.6808 | 1.2163 |
| litestar | 0.7298 | 0.8672 | 0.7399 | 0.9358 | 1.0319 |
| blacksheep | 0.7526 | 0.6177 | 0.7443 | 0.6334 | 1.0165 |
| sanic | 1.5398 | 1.7594 | 1.7422 | 1.5323 | 2.1398 |
| falcon | 1.096 | 1.0759 | 1.126 | 1.0734 | 1.2977 |
| quart | 1.5328 | 1.4848 | 1.477 | 1.5002 | 1.8719 |
| baseline | 0.6074 | 0.5356 | 0.5808 | 0.5312 | 0.7106 |
A word on the tail: p99 spreads of 40–80% are normal here, because a single slow repeat moves the maximum. The extreme is Starlette's validation, whose p99 median is 1.22 ms across repeats but whose worst repeat hit 10.50 ms (spread 802%). That is the one range the latency figure cannot draw to scale — its error bars are capped at 2.7 ms and the bar carries its true maximum above a break marker. Read this column as an order of magnitude — "does the framework add a millisecond or ten?" — not as a ranking.
Startup
Five cold processes per participant: import, build the application, and get a first request answered. All millisecond values are medians of those five; spread is across them.
| Participant | process (ms) | spread | import | build app | first request | lifespan |
|---|---|---|---|---|---|---|
| lauren | 707.14 | 27.84% | 318.34 | 98.5 | 3.9 | yes |
| fastapi | 942.92 | 14.94% | 301.91 | 309.63 | 3.27 | yes |
| starlette | 619.07 | 21.32% | 303.36 | 34.38 | 1.94 | yes |
| litestar | 1146.08 | 26.22% | 338.3 | 381.79 | 26.47 | yes |
| blacksheep | 708.9 | 19.69% | 306.69 | 118.85 | 4.71 | yes |
| sanic | 861.77 | 11.69% | 323.5 | 165.62 | 50.74 | yes |
| falcon | 617.12 | 31.19% | 286.07 | 67.59 | 3.67 | yes |
| quart | 883.14 | 19.85% | 299.54 | 245.15 | 5.39 | yes |
| baseline | 551.96 | 40.3% | 285.7 | 0.0 | 3.06 | yes |
process is what a user waits for: the parent measures the whole subprocess, so it includes interpreter boot and, at the end, the framework's teardown. The three phase columns come from inside the child and stop at the first answered request — they sum to child_total per sample, which excludes boot and teardown.
Note: Where the startup time actually goes
Every framework here spends 286–338 ms importing before it does anything else, and that term barely moves between them. The differences live in
build_appandfirst_request: Starlette (34 ms) and Falcon (68 ms) wire themselves up fastest, FastAPI (310 ms), Quart (245 ms) and Litestar (382 ms) slowest, and Lauren's 98 ms is mid-field — its startup validation is a design trade (/docs/comparisons/Lauren vs FastAPI, Litestar & BlackSheep: a startup error is a CI failure, a runtime error is a 3 a.m. page), but this table does not show it as an outlier. The two real handshake costs are Litestar's and Sanic'sfirst_requestat 26 ms and 51 ms; everyone else answers their first request in under 6 ms.
Serialization stacks
Numbers are only comparable when the work is comparable. This table records the JSON path, the validation path and the injection mechanism each participant actually used in this run.
| Participant | JSON encoder | Validation | Injection |
|---|---|---|---|
| lauren | stdlib json (lauren's StdlibJSONEncoder, the default) | built-in Json[PydanticModel] extractor | constructor injection from the @module provider graph |
| fastapi | stdlib json (Starlette JSONResponse; ORJSONResponse is opt-in) | built-in body annotation (pydantic) | Depends(callable), resolved per request |
| starlette | stdlib json (starlette.responses.JSONResponse) | manual — await request.json() then model_validate | none — app.state lookup inside the handler |
| litestar | msgspec (msgspec.json.Encoder via litestar.serialization) | built-in typed parameter (pydantic) | Provide(dependency) declared on the route |
| blacksheep | stdlib json (essentials.json.dumps, an optimised json.dumps) | built-in pydantic binding on the handler parameter | services.add_singleton + handler-parameter resolution |
| sanic | ujson (sanic.helpers prefers ujson when it is installed) | manual — request.json then model_validate | none — app.ctx lookup inside the handler |
| falcon | stdlib json (falcon.media.JSONHandler default) | manual — await req.get_media() then model_validate | constructor injection at route-registration time |
| quart | stdlib json (Quart's DefaultJSONProvider) | manual — await request.get_json() then model_validate | none — app.extensions lookup inside the handler |
| baseline | stdlib json (json.dumps) | manual — json.loads + pydantic model_validate | none — the handler is a literal dict |
Not measured: aiohttp and robyn
Both distributions are installed in the benchmark environment and both are listed in the artifact's not_measured section. Neither can be driven in-process, so neither has a number anywhere on this page.
aiohttp
Installed here as aiohttp 3.14.5. Entry point: none — aiohttp.web.Application is not an ASGI application.
aiohttp.web.Application exposes no ASGI callable: its call is a gunicorn-compatibility stub that takes no arguments and returns self, and the distribution ships no ASGI adapter. The only PyPI shims (aiohttp-asgi, aiohttp-asgi-connector) adapt in the opposite direction — they host an ASGI app on aiohttp's server — so they cannot put an aiohttp app behind ASGITransport. Hand-writing the bridge would measure the bridge, not aiohttp.
robyn
Installed here as robyn 0.88.0. Entry point: none — Robyn is a facade over a compiled Rust HTTP server.
Robyn's Python object configures a compiled Rust server that owns its own socket: the object exposes start()/serve(), defines no call, and the package ships no ASGI module (its submodules are router, ws, responses, ... but nothing ASGI). There is no in-process request path to drive, so no comparable number can be produced without measuring Robyn's own server against a socket, which is a different benchmark.
If you need a number for either, it has to come from a different benchmark: one that stands up the framework's own server and drives it over a socket. That measures the server too, which is a legitimate question — just not the one this page asks.
See also
- Lauren vs FastAPI, Litestar & BlackSheep — the design comparison this page measures one axis of.
benches/— the harness, the feasibility probe, the pinned requirements and the raw artifact this page is generated from.- Why Lauren? — the trade-offs the startup table above is a consequence of.